
Understanding the B–H Curve: A Visual Guide
Br, HcJ, BHmax and the knee where designs quietly die — the demagnetization curve answers the questions that matter, once you know where to look.
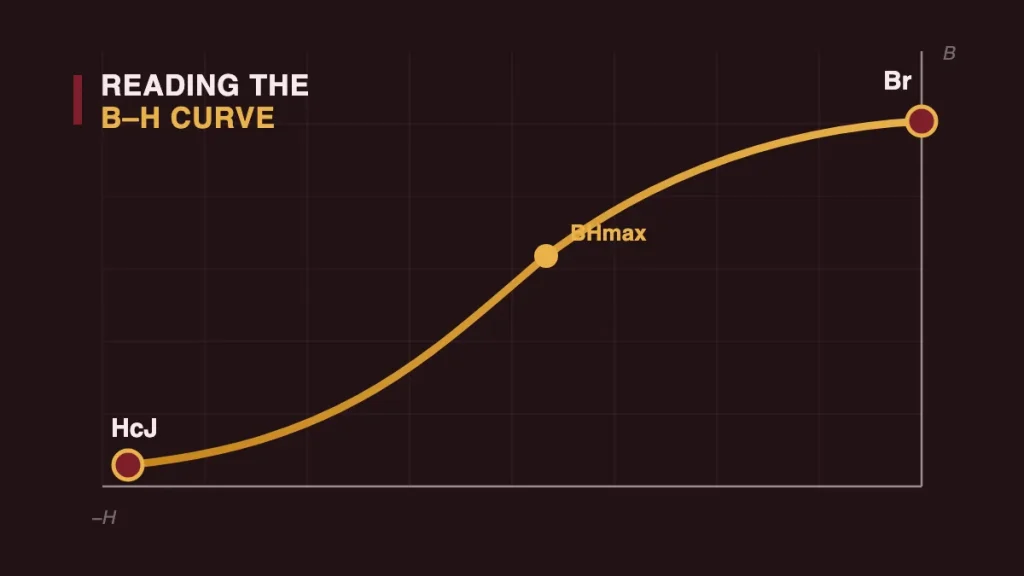
Open any magnet datasheet and you will meet it: a curve sweeping down through the second quadrant, dressed in cryptic symbols. The B–H demagnetization curve intimidates a lot of buyers into skipping it — which is a shame, because it answers the three questions that actually matter: how strong, how stubborn, and how close to failure your design is running.
What the axes mean
The horizontal axis is H — the demagnetizing field pushing against the magnet, growing to the left. The vertical axis is B — the flux density the magnet still delivers. The curve is the negotiation between the two: as the opposing field grows, output falls. Every permanent magnet in service lives somewhere on this line, at what engineers call its working point.
The three landmarks
- Br — where the curve meets the B axis. Zero opposing field, maximum flux: the magnet fresh out of the magnetizer. Higher Br means a stronger magnet at the surface.
- HcJ — how far left the material survives. The intrinsic coercivity marks the opposing field that permanently destroys magnetization. It is the material’s stubbornness rating.
- BHmax — the sweet spot. Somewhere mid-curve, the product of B and H peaks. That value names the grade: an N42’s B×H peaks around 42 MGOe. Our grade guide unpacks that numbering.
The knee: where designs quietly die
At room temperature the curve of a good NdFeB grade is nearly a straight line — push the working point around and it slides back, no harm done. But raise the temperature and a bend appears: the knee. Operate below the knee, even briefly, and part of the magnetization is gone for good. The magnet does not shatter or discolour; your device simply gets weaker and nobody knows why.
This is the buried reason temperature grades (M, H, SH) exist: their chemistry pushes the knee down and left, keeping the straight section available at temperatures where a standard N grade has already folded.
How to actually use the curve
- Find your working point. Your magnetic circuit — air gap, steel, magnet length — sets a load line; where it crosses the curve is where the magnet operates.
- Check it at temperature. Datasheets plot curves at several temperatures. Your working point must stay above the knee at the hottest realistic condition.
- Leave margin. We recommend staying comfortably clear of the knee — assembly shocks and current spikes push the point around in real life.
If plotting load lines is not your favourite afternoon, that is fine — it is ours. Send the geometry and temperature, and we will place your working point and recommend the most economical grade that keeps it safe.
FAQ
Why is the curve drawn in the second quadrant?
Because a working permanent magnet always faces some demagnetizing field — from its own shape, an air gap, or coils. The second quadrant is simply the region where magnets actually live: positive output, opposing field.
What is the difference between the normal and intrinsic curves?
Datasheets often show two lines. The intrinsic curve tracks the material’s own magnetization; the normal curve tracks usable output flux. The knee is easiest to spot on the intrinsic curve, working points are read on the normal one.
Does a thin magnet really demagnetize itself?
A short, wide magnet in open air operates low on its own curve — its own poles work against it. That is why a coin-thin disc can lose strength while a longer cylinder of the same grade is perfectly stable.